Using Internal cfa-dataops Data with nowcastNHSN
Source:vignettes/cfa-dataops-source.Rmd
cfa-dataops-source.Rmd
library(nowcastNHSN)
library(baselinenowcast)
library(ggplot2)
library(dplyr)
#>
#> Attaching package: 'dplyr'
#> The following objects are masked from 'package:stats':
#>
#>     filter, lag
#> The following objects are masked from 'package:base':
#>
#>     intersect, setdiff, setequal, union
Introduction
The nowcastNHSN package supports several data sources
for fetching vintaged NHSN hospital admissions data. The Getting Started vignette demonstrates
the Delphi Epidata API, and the Using
Forecast Hub Data vignette demonstrates pulling target timeseries
data from the forecast hub S3 buckets.
This vignette shows a third option,
cfa_dataops_source(), which is intended for CDC-internal
users. It reads NHSN hospital admissions snapshots archived by the CDC’s
cfa-dataops tooling, giving access to the same week-by-week reporting
history that the cfa-stf nowcasting and forecasting pipelines use
internally.
Because this source relies on internal tooling and Azure storage,
most users will prefer the Delphi or forecast hub sources. For those who
do have access, the interface returns data in the same
reporting-triangle schema as the other sources, so the rest of the
nowcastNHSN and baselinenowcast workflow is
unchanged.
Creating a cfa-dataops Source
Unlike the other sources, this one needs a small amount of setup
outside R. You will need the cfa-dataops Python package and
the relevant public catalog installed in an environment that R can
reach, and you will need Azure permissions for the underlying
storage.
A minimal uv-based setup looks like this:
uv tool install \
  "cfa-dataops @ git+https://github.com/CDCgov/cfa-dataops.git@main" \
  --with "cfa-catalog-public @ git+https://github.com/CDCgov/cfa-catalog-pub.git"
With that in place, cfa_dataops_source() creates a
source object. The target argument selects the disease
signal; dataops_save is picked up from PATH by
default.
source <- cfa_dataops_source(target = "covid")The available disease targets mirror the NHSN admissions columns used in the cfa-stf pipeline:
-
target = "covid"for new confirmed COVID-19 admissions -
target = "flu"for new confirmed influenza admissions -
target = "rsv"for new confirmed RSV admissions
By default the source reads from the preliminary NHSN dataset
(public.stf.nhsn_hrd_prelim). Set
prelim = FALSE to use the finalised dataset
(public.stf.nhsn_hrd) instead.
Fetching Reporting Data
The interface matches the other sources: pass Saturday week-ending
dates for reference_dates and report_dates,
and a vector of two-letter state abbreviations for
locations. Snapshots taken at different points within the
same MMWR epiweek are mapped to the Saturday ending that week, so that
report_date is always a Saturday and lines up with the
forecast hub convention.
reporting_data <- fetch_reporting_data(
  source = source,
  reference_dates = seq(
    as.Date("2025-05-10"),
    as.Date("2025-08-30"),
    by = "week"
  ),
  report_dates = seq(
    as.Date("2025-08-16"),
    as.Date("2025-09-06"),
    by = "week"
  ),
  locations = c("ca", "ny")
)
For the rest of this vignette, the reporting_data shown
below is loaded from a small pre-saved fixture rather than a live fetch.
This lets the vignette build without requiring cfa-dataops or Azure
access, but the shape and meaning of the data are exactly what a live
call would return.
head(reporting_data)
#> # A tibble: 6 × 5
#>   reference_date report_date location count signal
#>   <date>         <date>      <chr>    <dbl> <chr>
#> 1 2025-05-10     2025-08-16  ca         490 totalconfc19newadm
#> 2 2025-05-10     2025-08-16  ny         424 totalconfc19newadm
#> 3 2025-05-10     2025-08-23  ca         490 totalconfc19newadm
#> 4 2025-05-10     2025-08-23  ny         424 totalconfc19newadm
#> 5 2025-05-10     2025-08-30  ca         490 totalconfc19newadm
#> 6 2025-05-10     2025-08-30  ny         424 totalconfc19newadm
The returned data frame has the same columns as the Delphi and forecast hub sources:
-
reference_date: the Saturday ending the week when admissions occurred -
report_date: the Saturday ending the MMWR epiweek when the snapshot was taken -
location: lowercase two-letter state abbreviation -
count: cumulative admissions for that reference date, as of that report date -
signal: the NHSN column name for the chosen target (e.g.totalconfc19newadmfor COVID-19)
If more than one cfa-dataops snapshot falls in the same epiweek, the
default behaviour is to keep the most recent snapshot for that
report_date (dedup = "latest"). Pass
dedup = "earliest" to keep the first snapshot in each
report week instead:
reporting_data <- fetch_reporting_data(
  source = source,
  reference_dates = "*",
  report_dates = seq(
    as.Date("2025-08-16"),
    as.Date("2025-09-06"),
    by = "week"
  ),
  locations = "ca",
  dedup = "earliest"
)
Visualizing Reporting Delays
As with the other sources, counts for the same reference date change as later snapshots come in. The plot below uses California COVID-19 admissions from the fixture to show how the cumulative counts at a handful of reference dates evolve across report dates.
ca_data <- reporting_data |>
  filter(location == "ca")

all_report_dates <- sort(unique(ca_data$report_date))

selected_reports <- ca_data |>
  filter(report_date %in% all_report_dates)

ggplot(selected_reports, aes(x = reference_date, y = count, color = as.factor(report_date))) +
  geom_line(linewidth = 1) +
  geom_point(size = 2) +
  labs(
    title = "COVID-19 Hospital Admissions in California (cfa-dataops)",
    subtitle = "How reported counts change across snapshot vintages",
    x = "Reference Date (Week Ending)",
    y = "Confirmed Admissions",
    color = "Report Date"
  ) +
  theme_minimal() +
  theme(legend.position = "bottom") +
  scale_color_brewer(palette = "Set1")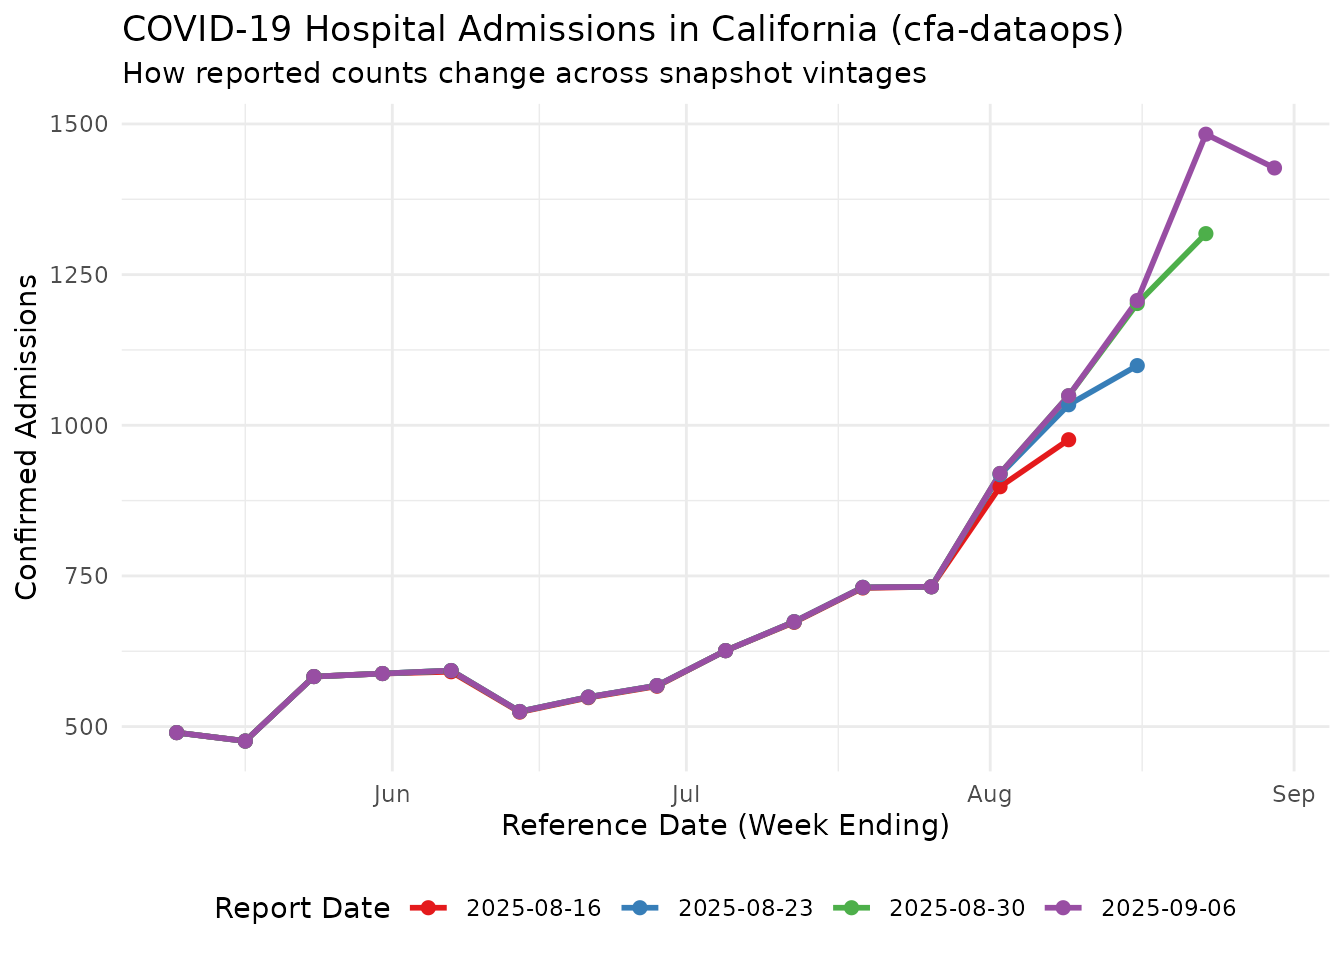
Each coloured line is a single snapshot (report date); each point on that line is the cumulative admissions reported for a given reference date as of that snapshot. Recent reference dates tend to be incomplete on their first appearance and are typically revised upward in later snapshots, though downward revisions also happen.
Preparing for Nowcasting
Because the returned data matches the common reporting-triangle schema, it plugs into the same pipeline as the other sources. We convert the cumulative counts to incremental (new reports at each snapshot) and then build a reporting triangle:
ca_incremental <- reporting_data |>
  filter(location == "ca") |>
  cumulative_to_incremental(group_cols = c("reference_date", "location", "signal"))

reporting_triangle <- as_reporting_triangle(ca_incremental, delays_unit = "weeks")
#> ℹ The dataframe contains report dates beyond the final reference date.
#> ℹ Using max_delay = 17 from data
print(reporting_triangle)
#> Reporting Triangle
#> Delays unit: weeks
#> Reference dates: 2025-05-10 to 2025-08-30
#> Max delay: 17
#> Structure: 2, 1, 1, 1, 1, 1, 1, 1, 1, 1, 1, 1, 1, 1, 1, 1
#>
#> Showing last 10 of 17 rows
#> Showing first 10 of 18 columns
#>
#>            0    1   2   3   4   5   6   7  8  9
#> 2025-06-28 0    0   0   0   0   0   0 567  1  0
#> 2025-07-05 0    0   0   0   0   0 626   0  0  0
#> 2025-07-12 0    0   0   0   0 673   1   0  0 NA
#> 2025-07-19 0    0   0   0 730   1   0   0 NA NA
#> 2025-07-26 0    0   0 732   0   0   0  NA NA NA
#> 2025-08-02 0    0 898  20   2   0  NA  NA NA NA
#> 2025-08-09 0  976  58  15   0  NA  NA  NA NA NA
#> 2025-08-16 0 1099 103   5  NA  NA  NA  NA NA NA
#> 2025-08-23 0 1318 165  NA  NA  NA  NA  NA NA NA
#> 2025-08-30 0 1427  NA  NA  NA  NA  NA  NA NA NA
#>
#> Use print(x, n_rows = NULL, n_cols = NULL) to see all data
From here, the reporting triangle can be passed to
baselinenowcast::baselinenowcast() in the same way as in
the Getting Started vignette.
Environment Requirements
This source only checks its environment at the point of use; you can
install and use the rest of nowcastNHSN without any of it.
When you do want to fetch live data through
cfa_dataops_source(), the machine running R needs:
- the
dataops_savecommand onPATH, or a full command path supplied viacommand - the relevant cfa-dataops catalog package installed in the same Python environment
- Azure authentication and permissions for the backing storage