testing_by_income_14d <- testing_df %>%
  left_join(distinct(onetable, id, incomelevel_value, state_region), by = "id") %>%
  group_by(date, data_source, incomelevel_value) %>%
  summarize(
    n_reporting = sum(!new_tests_original %in% c(0, NA_real_)),
    new_tests = sum(new_tests_original, na.rm = TRUE)
  ) %>%
  group_by(data_source, incomelevel_value) %>%
  arrange(date) %>%
  mutate(
    n_reporting_14d = roll_median(n_reporting, n = 14, align = "right", na.rm = TRUE, fill = NA_real_),
    new_tests_14d = roll_median(new_tests, n = 14, align = "right", na.rm = TRUE, fill = NA_real_)
  ) %>%
  ungroup() %>%
  filter(
    !incomelevel_value %in% c("Not classified", NA_character_),
    date >= "2021-01-01",
    date <= sunday_date,
  ) %>%
  select(-new_tests, -n_reporting) %>%
  pivot_longer(-date:-incomelevel_value) %>%
  mutate(
    name = case_when(
      name == "n_reporting_14d" ~ "Countries Reporting",
      name == "new_tests_14d" ~ "New Tests Reported"
    ),
    incomelevel_value = factor(
      tools::toTitleCase(incomelevel_value),
      levels = c(
        "Low Income",
        "Lower Middle Income",
        "Upper Middle Income",
        "High Income"
      ),
      ordered = TRUE
    )
  )
testing_by_income_plot <- ggplot(testing_by_income_14d, aes(x = date, y = value, color = name, linetype = data_source)) +
geom_line() +
facet_grid(name ~ incomelevel_value, scales = "free_y", switch = "y") +
scale_y_continuous(labels = scales::comma) +
scale_x_date(
date_labels = "%b\n%Y"
) +
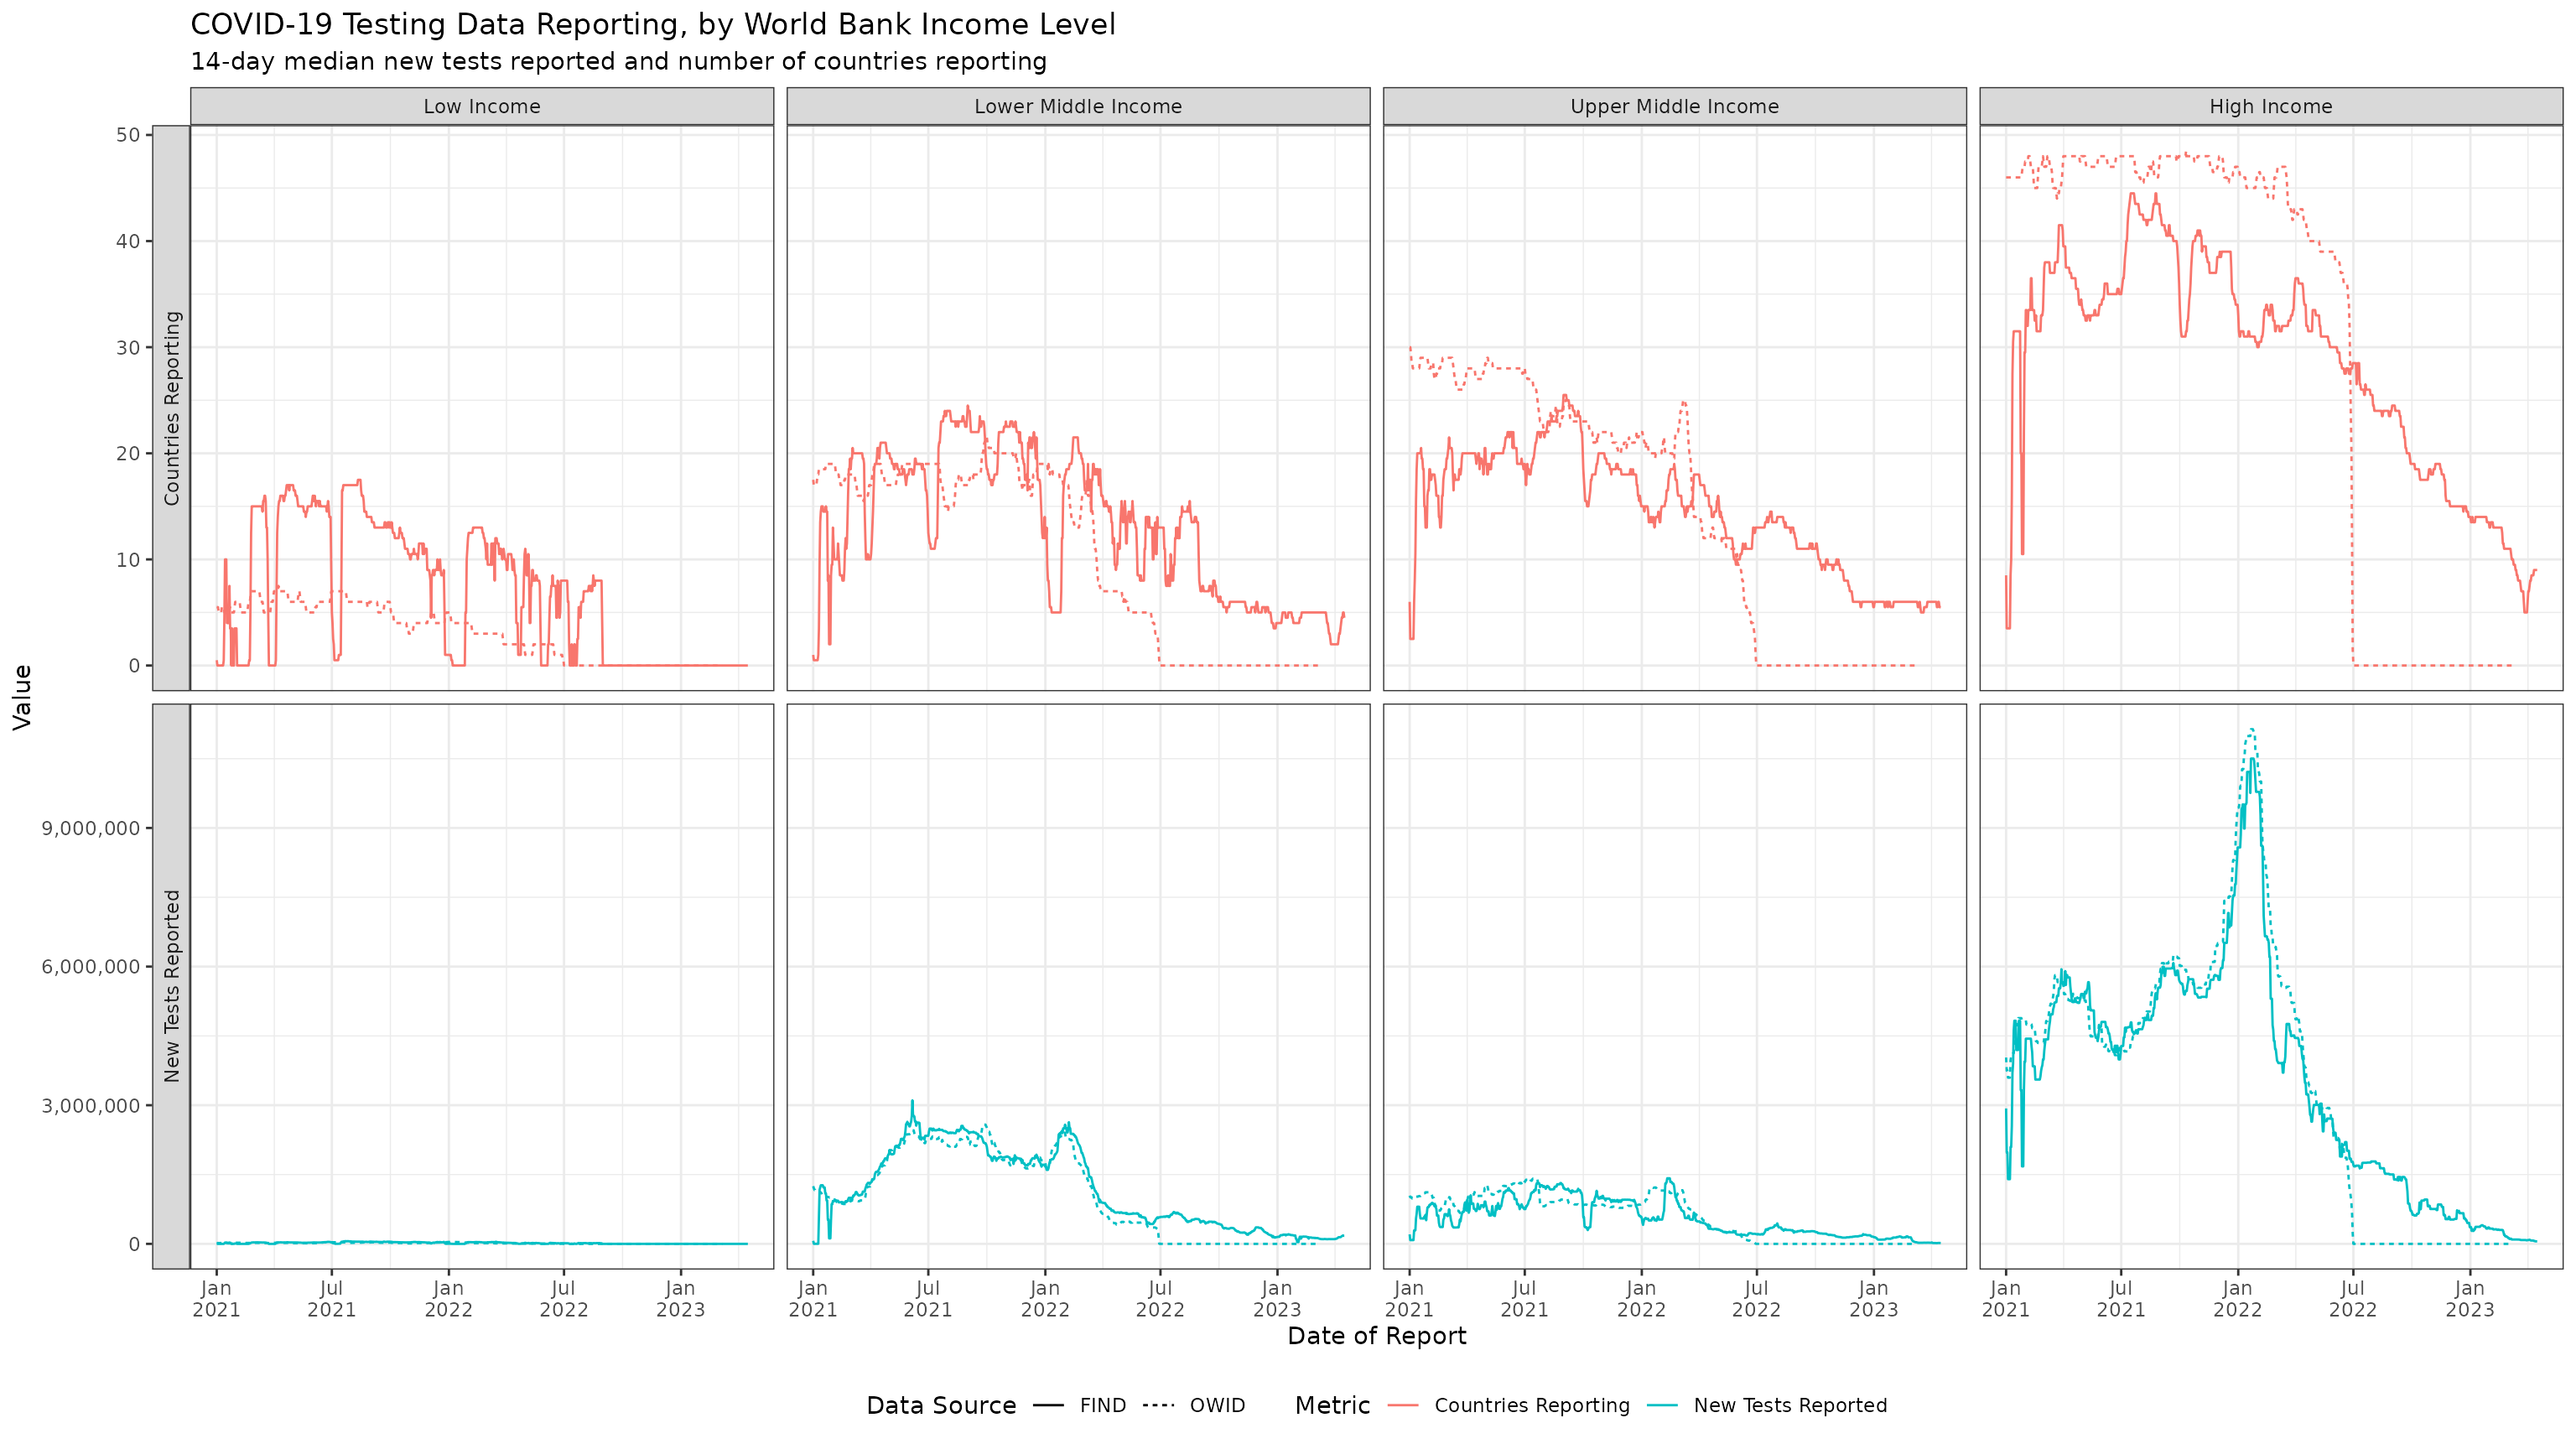
labs(
title = "COVID-19 Testing Data Reporting, by World Bank Income Level",
subtitle = "14-day median new tests reported and number of countries reporting",
x = "Date of Report",
y = "Value",
color = "Metric",
linetype = "Data Source"
) +
theme_bw() +
theme(
legend.position = "bottom"
)
testing_by_income_plot