Get limits spanning a set of values that are symmetric about a central value
Source:R/utils.R
sym_limits.RdThis is useful for making the axis range of a plot symmetric about a key central value.
Arguments
- values
Vector of values.
- transform
Transformation to apply to the values. Passed to
scales::as.transform(). Default"identity".- center
Custom center value for the span on the untransformed scale. If not specified, the span will be centered at 0 on the transformed scale.
Value
a length-two vector whose entries are
symmetric about center on the transformed scale
and span the range of values.
Details
Given a center point center and a set of values values, returns
c(center - x, center + x) where x is the entry of values that is
farthest from center (i.e. x <- max(abs(values - center))) on the
transformed scale.
If a custom center point is not specified, sym_limits()
centers values around 0 on the transformed scale.
Examples
sym_limits(c(-5.1, 2.2, 7.1))
#> [1] -7.1 7.1
# centered at 1, which corresponds to 0 on the
# transformed scale
sym_limits(values = c(0.4, 10), transform = "log10")
#> [1] 0.1 10.0
sym_limits(values = c(2, 9), transform = "sqrt", center = 4)
#> [1] 1 9
library(ggplot2)
library(tibble)
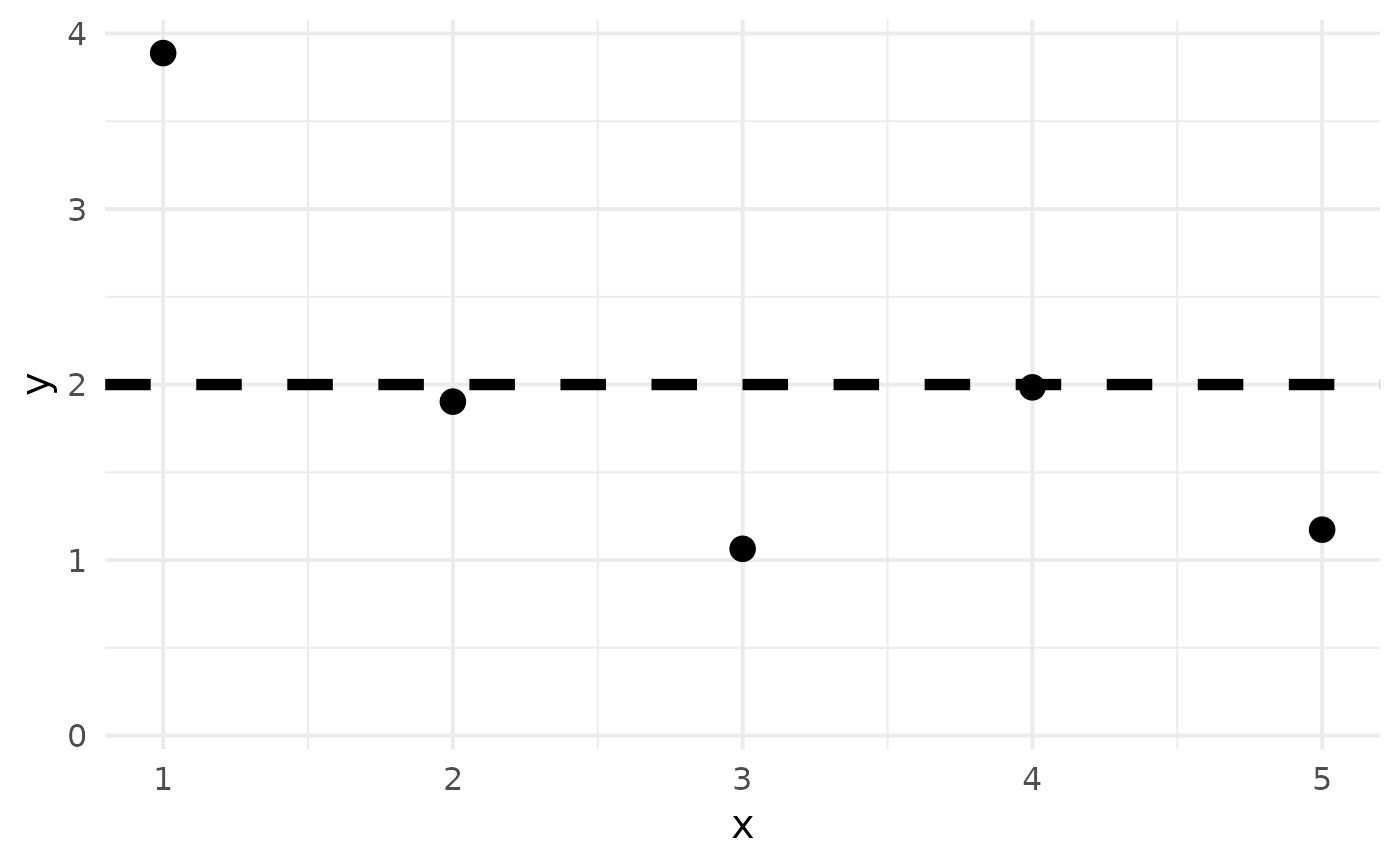
data <- tibble(x = 1:5, y = rnorm(5, mean = 2))
plot <- ggplot(
data = data,
mapping = aes(x = x, y = y)) +
geom_hline(yintercept = 2, linewidth = 2, linetype = "dashed") +
geom_point(size = 4) +
coord_cartesian(ylim = sym_limits(data$y, center = 2)) +
theme_forecasttools()
plot
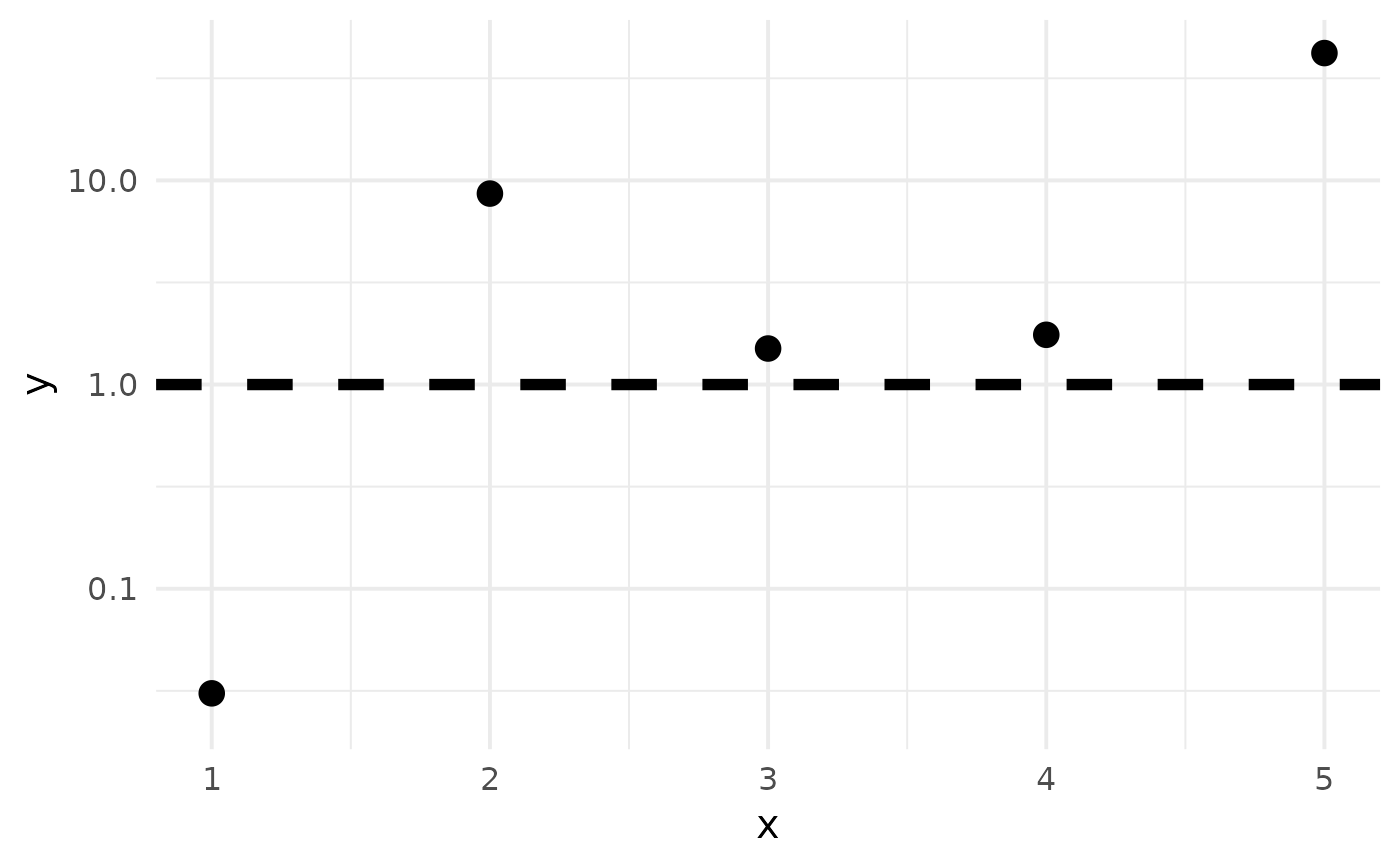
 data_log <- tibble(x = 1:5, y = 10^rnorm(5))
plot_log <- ggplot(
data = data_log,
mapping = aes(x = x, y = y)) +
geom_hline(yintercept = 1, linewidth = 2, linetype = "dashed") +
geom_point(size = 4) +
scale_y_continuous(transform = "log10") +
coord_cartesian(ylim = sym_limits(data_log$y, transform = "log10")) +
theme_forecasttools()
plot_log
data_log <- tibble(x = 1:5, y = 10^rnorm(5))
plot_log <- ggplot(
data = data_log,
mapping = aes(x = x, y = y)) +
geom_hline(yintercept = 1, linewidth = 2, linetype = "dashed") +
geom_point(size = 4) +
scale_y_continuous(transform = "log10") +
coord_cartesian(ylim = sym_limits(data_log$y, transform = "log10")) +
theme_forecasttools()
plot_log