Prism color scale
Usage
prism_colors

prism_levels

scale_fill_prism(...)

scale_color_prism(...)

scale_colour_prism(...)
Format
An object of class list of length 3.
An object of class ordered (inherits from factor) of length 6.
Arguments
- ...
Other arguments passed on to
ggplot2::discrete_scale()
Examples
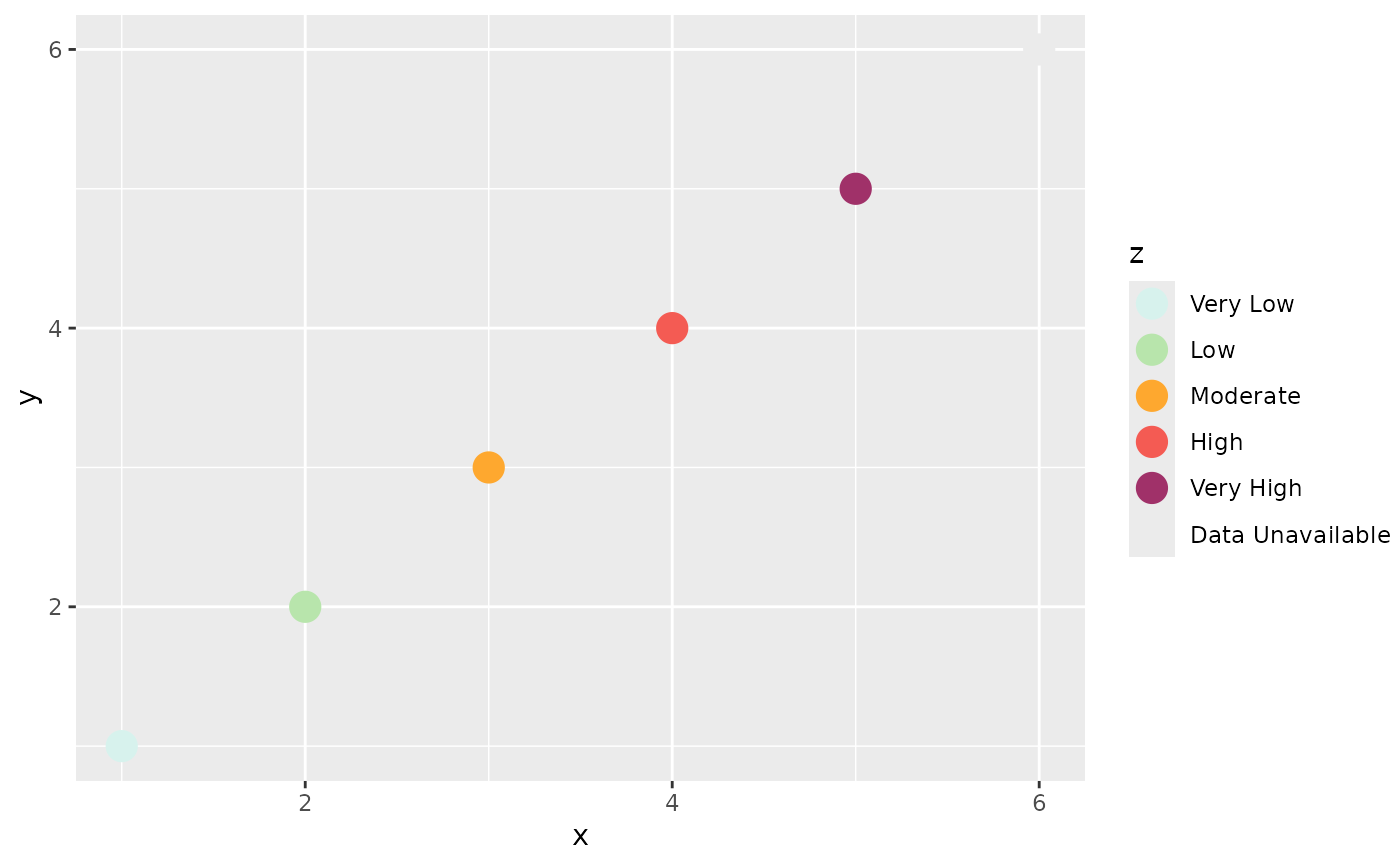
ex_dat <- data.frame(
  x = 1:6, y = 1:6,
  z = c("Very Low", "Low", "Moderate", "High", "Very High", NA)
)
# Basic plot
ex_dat |>
  ggplot2::ggplot(ggplot2::aes(x, y, color = z)) +
  ggplot2::geom_point(size = 5) +
  scale_color_prism()


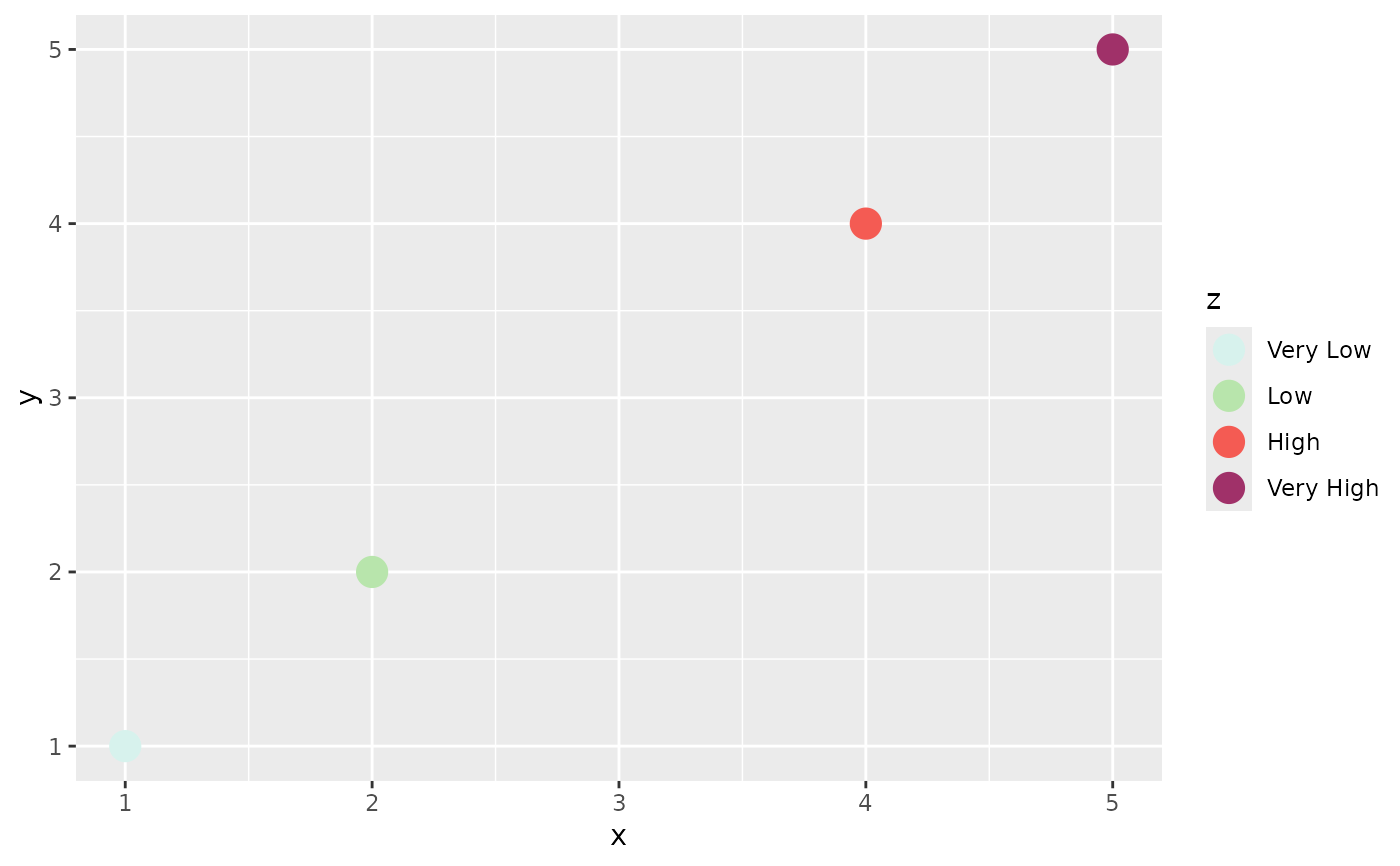
# Dropping levels drops them from the legend
ex_dat |>
  tidyr::drop_na() |>
  dplyr::filter(z != "Moderate") |>
  ggplot2::ggplot(ggplot2::aes(x, y, color = z)) +
  ggplot2::geom_point(size = 5) +
  scale_color_prism()


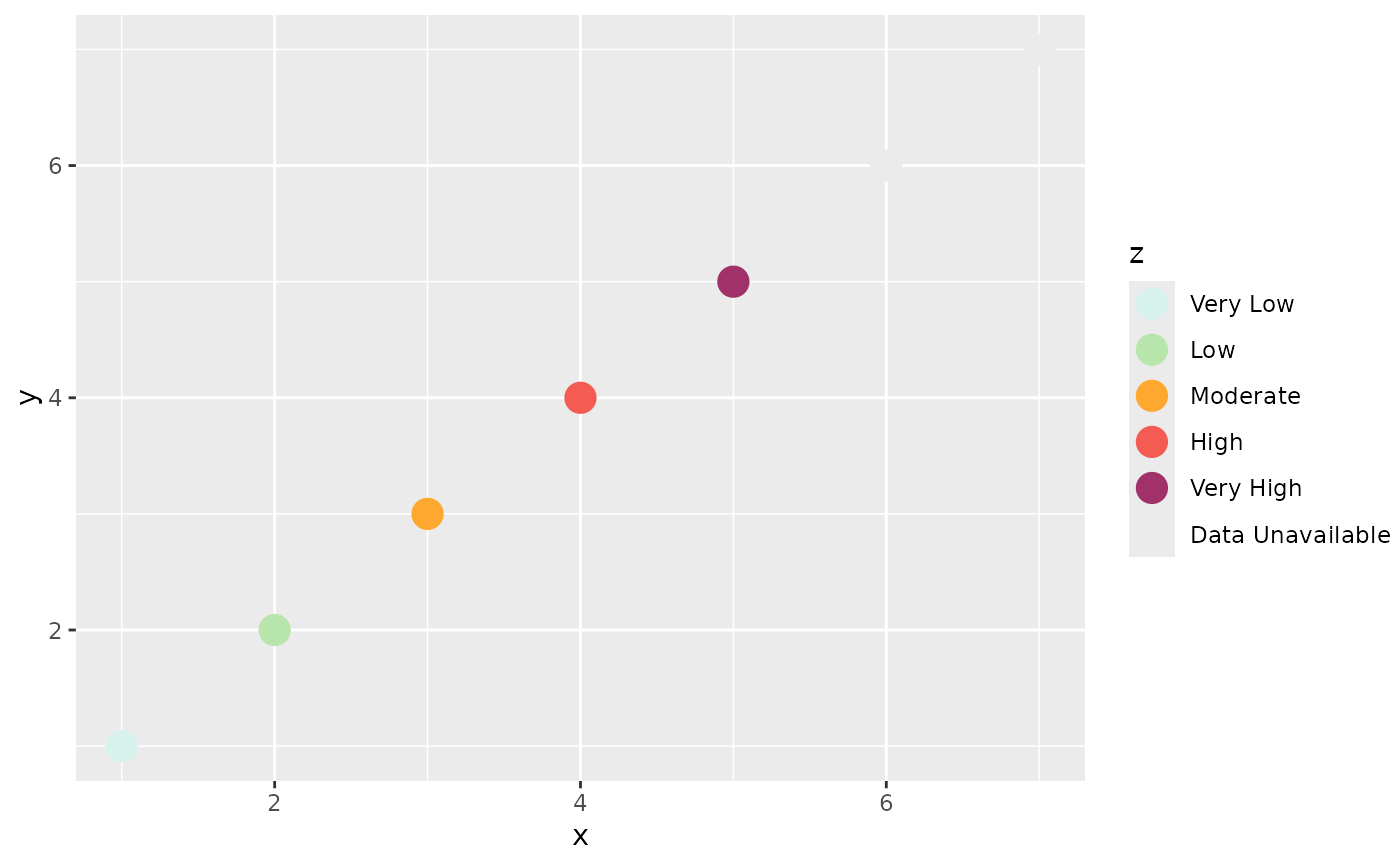
# New level gets converted to NA
ex_dat |>
  tibble::add_row(x = 7, y = 7, z = "new level") |>
  ggplot2::ggplot(ggplot2::aes(x, y, color = z)) +
  ggplot2::geom_point(size = 5) +
  scale_color_prism()
