Plot median predictions and prediction intervals as pointintervals against observed data
Source:R/plot_scorable_table.R
plot_pred_obs_pointintervals.RdPlot median predictions and prediction intervals as pointintervals against observed data
Usage
plot_pred_obs_pointintervals(
  scorable_table,
  interval_widths = c(0.5, 0.95),
  target_date_col = "target_end_date",
  horizon_col = "horizon",
  reference_date_col = "reference_date",
  predicted_col = "predicted",
  observed_col = "observed",
  quantile_level_col = "quantile_level",
  x_label = "Date",
  y_label = "Target",
  y_transform = "log10",
  quantile_tol = 10,
  predicted_point_size = 3,
  predicted_point_shape = 23,
  predicted_point_fill = "lightblue",
  predicted_interval_color = "darkblue",
  observed_point_size = 3,
  observed_point_shape = 21,
  observed_point_fill = "darkred",
  observed_linetype = "solid",
  observed_linewidth = 1,
  observed_linecolor = "black"
)
Arguments
- scorable_table
quantile table with observations, as the output of
scoringutils::as_forecast_quantile(), or as a table coercible to ascoringutils-ready quantile forecast viascoringutils::as_forecast_quantile(). Must contain the median (0.5) quantile and the endpoint quantiles for the equal-tailed prediction interval specified inprediction_interval_width. Must contain a column specifying the forecast horizon. Plot will be faceted into rows and columns, with rows representing different horizons and columns representing all other forecast unit variables beside horizon and target date.- interval_widths
Width(s) of the equal-tailed prediction interval(s) to plot around the median. Must correspond to quantiles available in
scorable_table. Defaultc(0.5, 0.95).- target_date_col
Name of the column in
scorable_tablegiving the forecast target date for a given prediction. Default"target_end_date"(as in hubverse schema).- horizon_col
Name of the column in
scorable_tablecontaining the forecast horizon for a given row. Default"horizon"(as in hubverse schema).- reference_date_col
Name of the column in
scorable_tablecontaining the forecast "reference date": the target date corresponding to the 0 horizon. Silently dropped if present because it is redundant withhorizon_col. Default"reference_date"(as in hubverse schema).- predicted_col
Name of the column in
scorable_tablegiving the predicted values. Default"predicted"(as in the output ofscoringutils::as_forecast_quantile(). Passed as thepredictedargument toscoringutils::as_forecast_quantile().- observed_col
Name of the column in
scorable_tablegiving the observed values. Default"observed"(as in the output ofscoringutils::as_forecast_quantile()). Passed as theobservedargument toscoringutils::as_forecast_quantile().- quantile_level_col
Name of the column in
scorable_tablegiving the quantile level for a given row. Default"quantile_level"(as in the output ofscoringutils::as_forecast_quantile()). Passed as thequantile_levelargument toscoringutils::as_forecast_quantile().- x_label
Label for the x axis in the plot. Default
"Date".- y_label
Label for the y axis in the plot. Default
"Target".- y_transform
Transformation for the y axis in the plot. Passed as the
transformargument toggplot2::scale_y_continuous(). Default"log10".- quantile_tol
Round quantile level values to this many decimal places, to avoid problems with floating point number equality comparisons. Affects both the target quantile level values determined from
prediction_interval_widthand the quantile level values in thequantile_level_colcolumn ofscorable_table. Passed as thedigitsargument tobase::round(). Default10.- predicted_point_size
Size for the points showing median predictions. Passed as the
point_sizeargument toggdist::geom_pointinterval(). Default3.- predicted_point_shape
Shape for the points showing median predictions. Passed as the
shapeargument toggdist::geom_pointinterval(). Default23(filled diamonds).- predicted_point_fill
Fill color for the points showing median predictions. Passed as the
point_fillargument toggdist::geom_pointinterval(). Default"lightblue".- predicted_interval_color
Color for the lines showing predictions intervals. Passed as the
interval_colorargument toggdist::geom_pointinterval()Default"darkblue".- observed_point_size
Size for the points showing observed values. Passed as the
sizeargument togeom_line_point(). Default3.- observed_point_shape
Shape for the points showing observed values. Passed as the
shapeargument togeom_line_point(). Default21(filled circles).- observed_point_fill
Fill color for the points showing observed values. Passed as the
fillargument togeom_line_point(). Default"darkred".- observed_linetype
Type of line to connect the timeseries of observed values. Passed as the
"linetype"argument togeom_line_point(). Default"solid".- observed_linewidth
Width for the line connecting the timeseries of observed values. Passed as the
"linewidth"argument togeom_line_point(). Default1.- observed_linecolor
Color for the line connecting the timeseries of observed values. Passed as the
"color"argument togeom_line_point(). Default"black".
Value
The plot, as a ggplot2::ggplot() object.
Examples
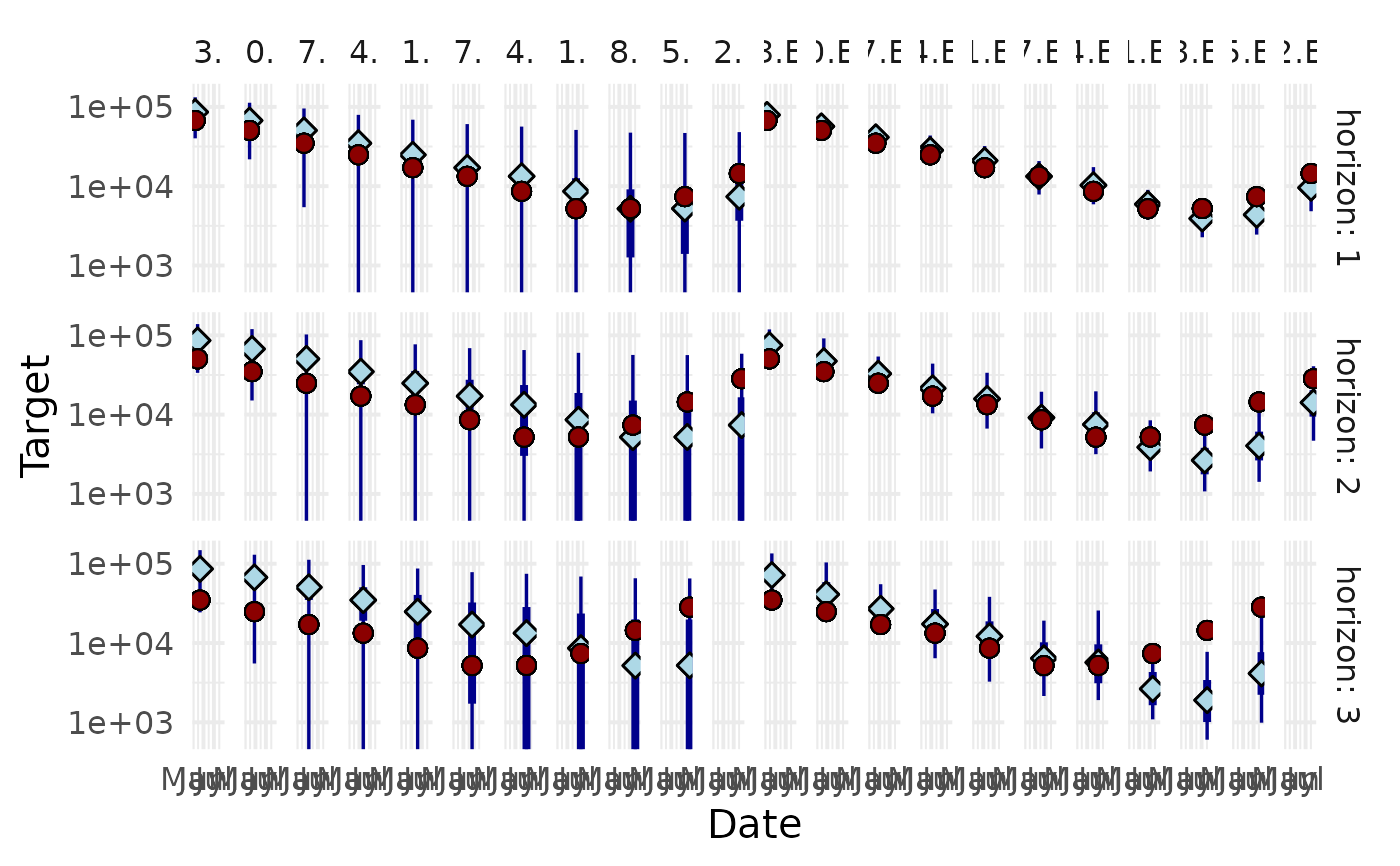
scoringutils::example_quantile |>
dplyr::filter(
location == "IT",
target_type == "Cases",
model == "EuroCOVIDhub-ensemble"
) |>
plot_pred_obs_pointintervals()
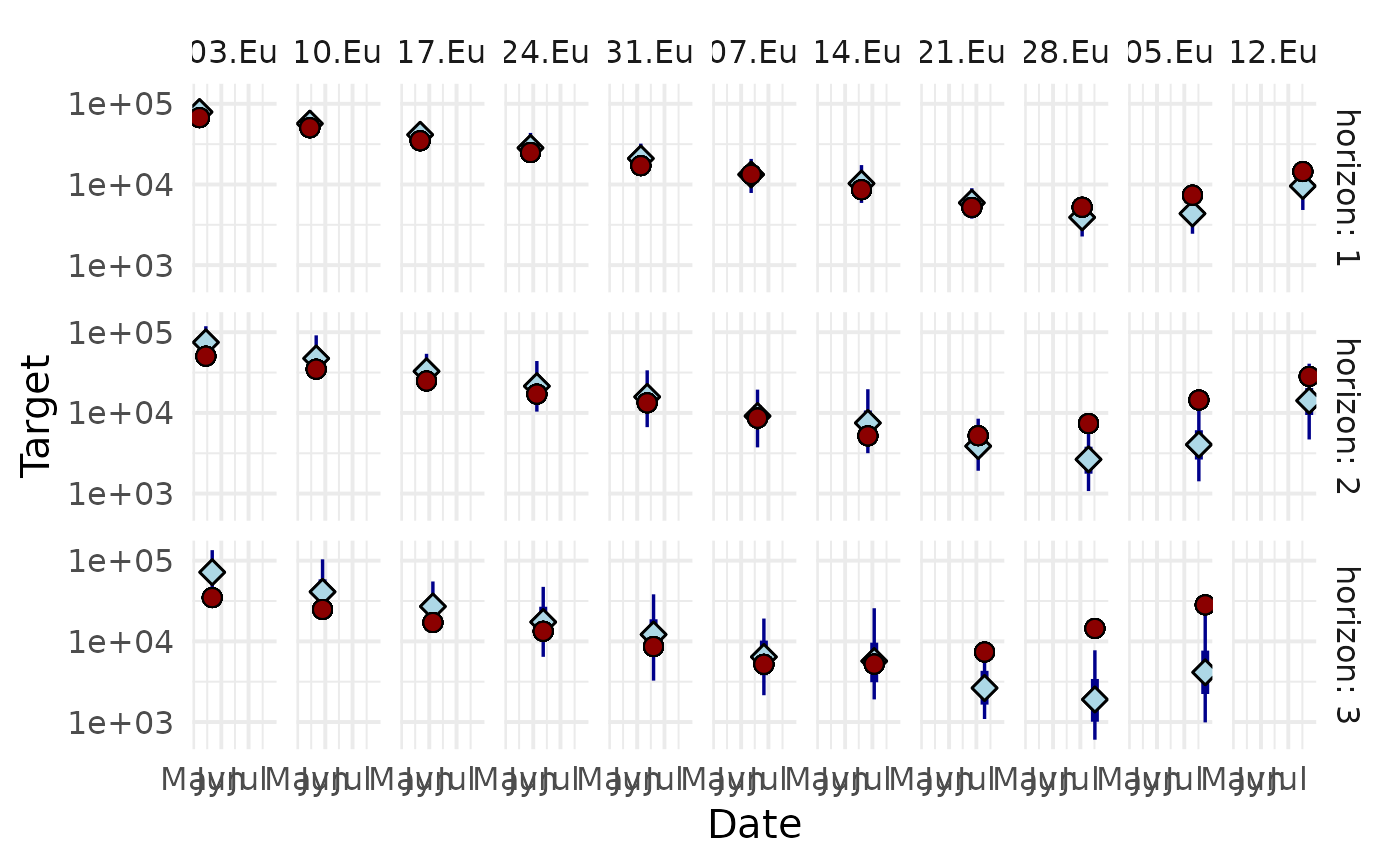 scoringutils::example_quantile |>
dplyr::filter(
location == "IT",
target_type == "Cases",
model %in% c("EuroCOVIDhub-ensemble", "EuroCOVIDhub-baseline")
) |>
plot_pred_obs_pointintervals()
#> Warning: log-10 transformation introduced infinite values.
scoringutils::example_quantile |>
dplyr::filter(
location == "IT",
target_type == "Cases",
model %in% c("EuroCOVIDhub-ensemble", "EuroCOVIDhub-baseline")
) |>
plot_pred_obs_pointintervals()
#> Warning: log-10 transformation introduced infinite values.