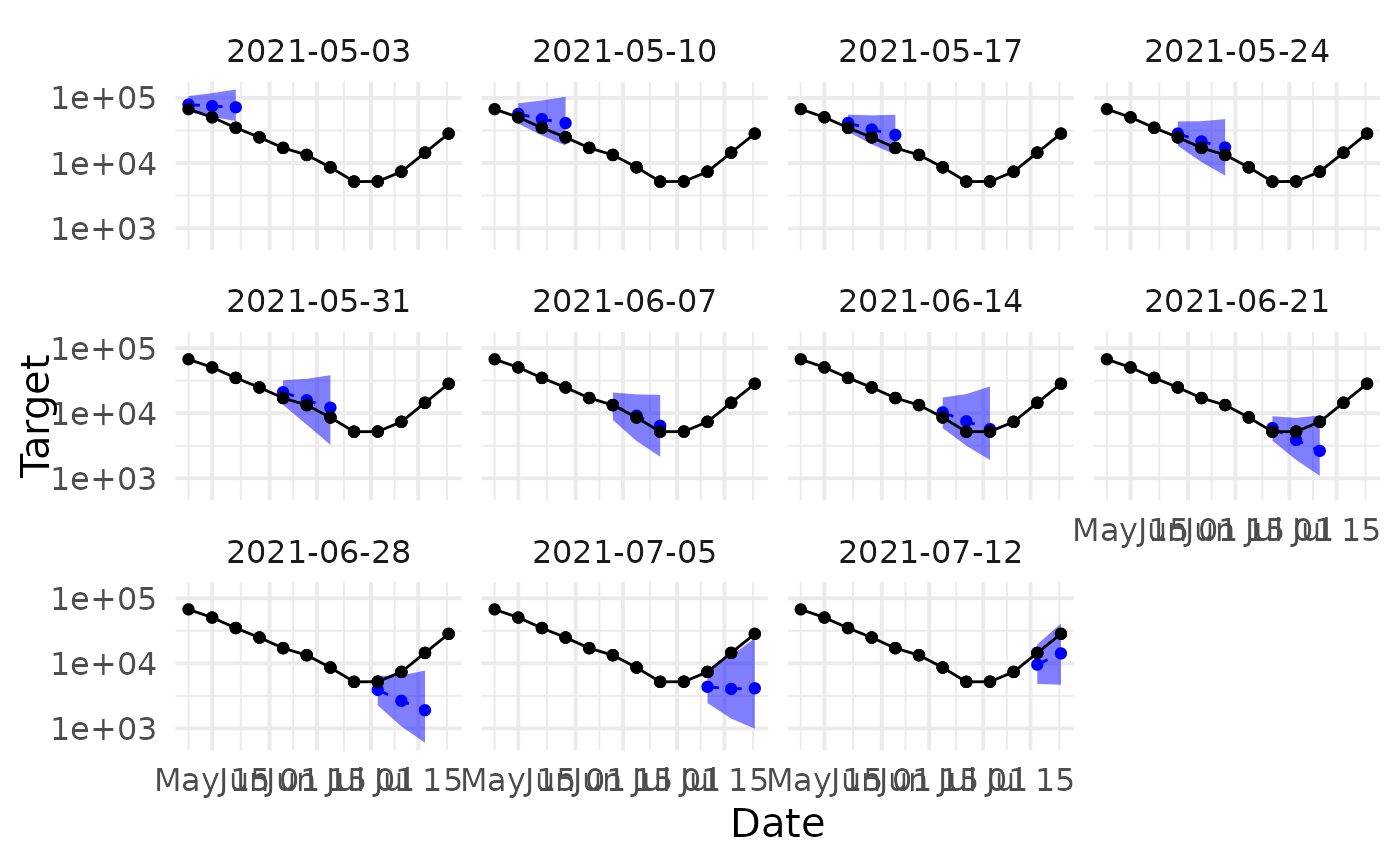
Plot median predictions and prediction intervals against observed data by forecast date.
Source:R/plot_scorable_table.R
plot_pred_obs_by_forecast_date.RdPlot median predictions and prediction intervals against observed data by forecast date.
Usage
plot_pred_obs_by_forecast_date(
  scorable_table,
  horizons = NULL,
  prediction_interval_width = 0.95,
  forecast_date_col = "reference_date",
  target_date_col = "target_end_date",
  predicted_col = "predicted",
  observed_col = "observed",
  quantile_level_col = "quantile_level",
  horizon_col = "horizon",
  facet_columns = NULL,
  x_label = "Date",
  y_label = "Target",
  y_transform = "log10",
  quantile_tol = 10
)
Arguments
- scorable_table
quantile table with observations, as the output of
scoringutils::as_forecast_quantile(), or as a table coercible to ascoringutils-ready quantile forecast viascoringutils::as_forecast_quantile(). Must contain the median (0.5) quantile and the endpoint quantiles for the equal-tailed prediction interval specified inprediction_interval_width.- horizons
Forecast horizons to plot. If
NULL, plot all available horizons. DefaultNULL.- prediction_interval_width
Width of the equal-tailed prediction interval to plot around the median. Must correspond to quantiles available in
scorable_table. Default0.95(plot the range from quantile0.025to quantile0.975).- forecast_date_col
Name of the column in
scorable_tablegiving the forecast date or forecast reference date. Default"reference_date"(as in hubverse schema).- target_date_col
Name of the column in
scorable_tablegiving the forecast target date for a given prediction. Default"target_end_date"(as in hubverse schema).- predicted_col
Name of the column in
scorable_tablegiving the predicted values. Default"predicted"(as in the output ofscoringutils::as_forecast_quantile(). Passed as thepredictedargument toscoringutils::as_forecast_quantile().- observed_col
Name of the column in
scorable_tablegiving the observed values. Default"observed"(as in the output ofscoringutils::as_forecast_quantile(). Passed as theobservedargument toscoringutils::as_forecast_quantile().- quantile_level_col
Name of the column in
scorable_tablegiving the quantile level for a given row. Default"quantile_level"(as in the output ofscoringutils::as_forecast_quantile(). Passed as thequantile_levelargument toscoringutils::as_forecast_quantile().- horizon_col
Name of the column in
scorable_tablecontaining the forecast horizon for a given row. Default"horizon"(as in hubverse schema).- facet_columns
Columns in
scorable_tableby which to facet the resulting plot. Will always facet byforecast_date_col. IfNULL, facet by all the columns that make up thescoringutils"forecast unit", as determined byscoringutils::get_forecast_unit(), except fortarget_date_colandhorizon. This means that, by default, two distinct predictions for a given target date and horizon should not be visualized on the same facet. To facet only by the forecast date column, pass that column name again, or pass"".- x_label
Label for the x axis in the plot. Default
"Date".- y_label
Label for the y axis in the plot. Default
"Target".- y_transform
Transformation for the y axis in the plot. Passed as the
transformargument toggplot2::scale_y_continuous()Default"log10".- quantile_tol
Round quantile level values to this many decimal places, to avoid problems with floating point number equality comparisons. Affects both the target quantile level values determined from
prediction_interval_widthand the quantile level values in thequantile_level_colcolumn ofscorable_table. Passed as thedigitsargument tobase::round(). Default 10.
Value
The plot, as a ggplot2::ggplot() object.
Examples
scoringutils::example_quantile |>
  dplyr::filter(
    location == "IT",
    target_type == "Cases",
    model == "EuroCOVIDhub-ensemble"
  ) |>
  plot_pred_obs_by_forecast_date(
    forecast_date_col = "forecast_date",
    facet_columns = "" # facet only by forecast date
  )
